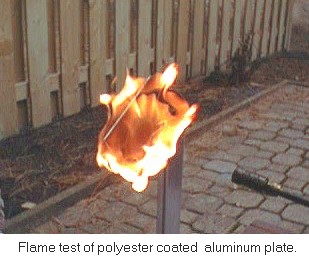
The tests were performed by using a propane torch to vigorously heat the coated side of the plate, while monitoring temperature of the opposite side of the plate by use of a computer data acquisition system which sampled the plate temperature at a rate of 3 readings per second.
The test results are shown in Figure 1. The rate at which heating of the plate varied with time, for the various coatings, is shown in Figure 2. This can be seen to be approximately linear with thickness.
Note that in Figure 1, the "kink" in the heating curve is a result of a phase change in the solder attaching the thermocouple. Also note that heating terminated at the peak of each curve.
Download Test Report
Polyflam.doc